I thought I'd plot the graphs that sparekh wanted (I was feeling pretty jobless at the time, despite a lot of work). I basically wrote a program (in Python, in case anyone cares) and used gnuplot (debateably to most powerful free plotting utility) to create the images.

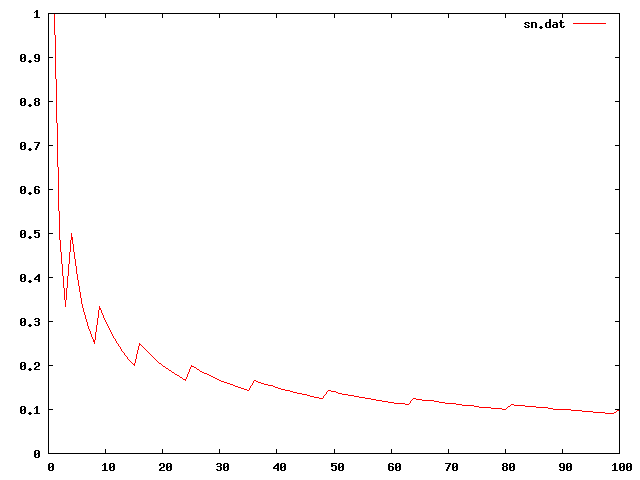
-> This is the graph for N = 100
This is the graph whe N = 1000 ->

 -> This is the graph for N = 100

No comments:
Post a Comment